Quick take
We break down who this device is best for, what it measures, and how it compares in the market.
Introduction: Why Home Patient Monitor Trends Matter
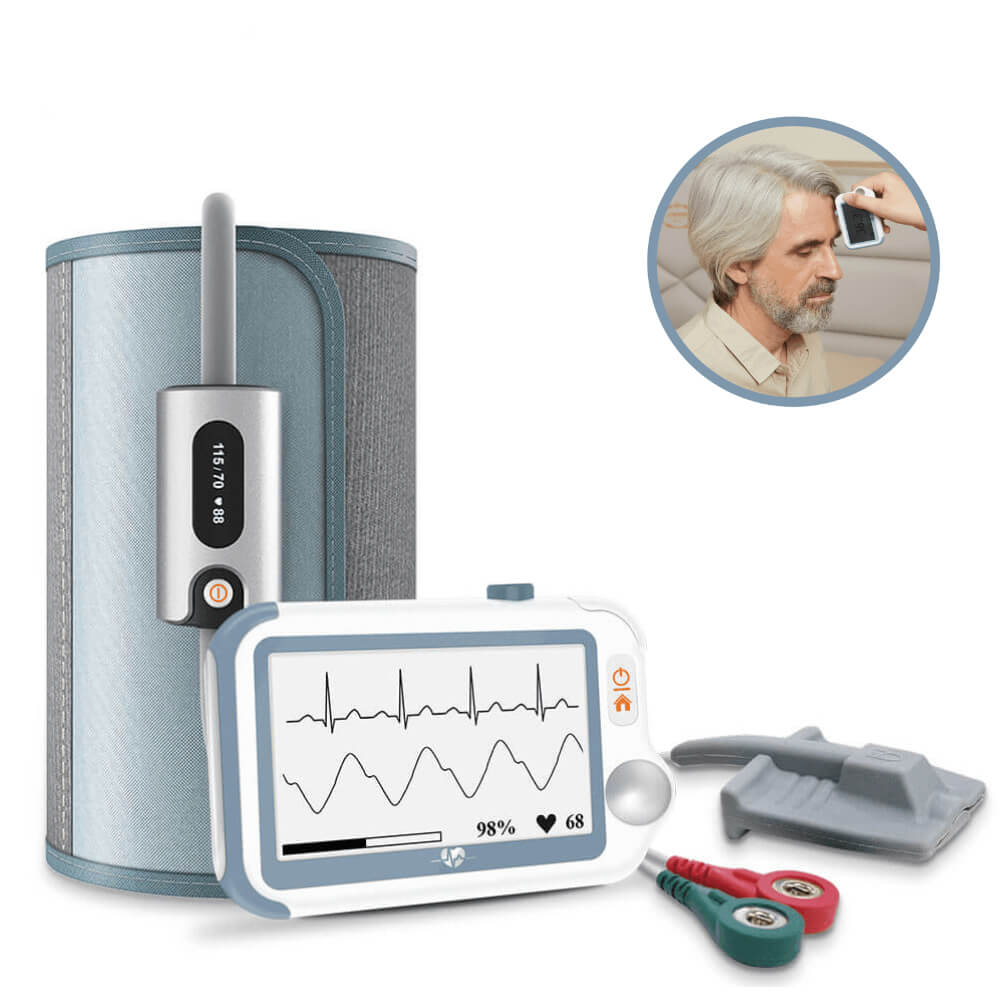
Home health technology lets you do more than capture a one-off reading. Devices like the Checkme Pro Vital Signs Monitor and modern BP, ECG, and sleep therapy monitors log your key numbers over days and weeks. Understanding these trends gives everyday users the power to spot patterns, track progress, and raise the right questions with their care team. If you’re managing high blood pressure, heart rhythm issues, or sleep apnea, knowing how to read home patient monitor trends helps you make real-world decisions for your health.
Who this is for
This guide is designed for anyone using home ECG monitors, overnight oxygen trackers, blood pressure devices, or sleep therapy systems (like CPAP) who wants to understand their trend reports. Whether you’re a proactive patient, a caregiver, or simply want clearer insight into your numbers, this practical how-to is for you.
Key Takeaways
- Home patient monitor trends offer actionable insight for proactive health decisions.
- Spotting patterns in your data is often more important than individual readings.
- Consistent device use and proper maintenance ensure more reliable reports.
- The right device for you depends on your health goals and how you want to share reports with your provider.
Key Metrics in Home Monitoring Devices: What to Look For
ECG & Rhythm: Identifying Heart Health Patterns
Home ECG monitors provide a single-lead or multi-lead view of your heart’s rhythm. Instead of focusing on one result, look for recurring irregularities or sudden changes in your heart rate trend. The best home ECG monitor for report sharing will let you export results for your clinician. Comparing a home ECG monitor vs Holter monitor: Holter devices capture every beat over 24–48 hours, while home monitors are better for frequent spot checks and sharing snapshots.
Overnight Oxygen Monitoring: Spotting Desaturation Events
Devices track SpO2 (blood oxygen saturation) throughout the night, flagging drops below normal (usually 90–92%). The best overnight oxygen monitor for home use presents these as timelines or event markers. A pattern of repeated low values, especially if you use sleep therapy, can be worth discussing with your doctor.
Blood Pressure Trends: Interpreting Numbers Over Time
For hypertension, a cheap and best BP monitor is one that’s accurate, consistent, and logs readings over days. Don’t panic over a single high number—look for sustained patterns above 130/80 mm Hg (per Mayo Clinic and NHLBI guidance). Morning surges or a gradual upward trend may matter more than a one-off spike.
Sleep Therapy Device Data: CPAP/APAP/BiPAP Reports Explained
Sleep therapy reports from CPAP/APAP/BiPAP devices track usage hours, mask seal quality, and apnea events per hour. Consistent use and lower event rates indicate good control. Sudden increases in apnea index, leaks, or hours below target are worth reviewing, especially if you feel unrefreshed.
Reading and Interpreting Trend Reports: A Step-By-Step Guide
- Access trend data: Open your monitor’s app or onboard menu (e.g., Checkme Pro’s touchscreen or phone app). Find the trend or history section—usually listed by date.
- Understand core metrics: For ECG, focus on heart rate and rhythm flags. For SpO2, look for average, lowest, and event counts. For BP, review systolic, diastolic, and pulse trends.
- Recognize patterns: Are your readings mostly stable, or is there a clear upward/downward shift? Are there clusters of abnormal events?
- Interpret graphs and tables: Line graphs show changes over time; tables summarize each session. Alerts (such as high BP or irregular rhythm) highlight readings outside typical ranges but are not diagnoses.
- Export or share reports: Many devices let you email or download PDFs to share with your provider. The best home ECG monitors for report sharing make this process simple and secure.
Actionable Questions to Ask After Reviewing Your Trends
- Are my readings generally steady or changing over time?
- Do I see repeated abnormal events (e.g., frequent low oxygen, multiple high BP mornings)?
- How do my numbers compare to my provider’s target range?
- Have I changed medication, activity, or sleep routine that could explain these trends?
- When in doubt or if you notice a new pattern, reach out to your healthcare provider for advice.
Example: If you notice a week of elevated blood pressure after months of normal readings, note any lifestyle changes and ask your provider if a medication adjustment or further testing is needed. For irregular ECG findings, especially new or recurring, save the report and discuss it at your next visit.
Device-Specific Tips: Making the Most of Your Home Monitoring Setup
| Device | Best For | Report Sharing | Limitation | Actions |
|---|---|---|---|---|
| All-in-one home use: ECG, SpO2, BP, temp, heart rate | App + export (PDF/email) | Feature depth varies, app setup required | ||
| Comprehensive multi-parameter tracking, best for supervised or clinical use | On-device, export via printer or USB | Larger size, designed for bedside/clinic |

If you’re unsure, start with a home-focused device like Checkme Pro. It’s compact and straightforward, ideal for tracking trends at home without much setup. If you need multi-parameter monitoring for a complex condition or want to compare home ECG monitor vs Holter monitor, speak with your provider for tailored advice.
Quick Decision Cues
- For spot checks and easy sharing: Checkme Pro Vital Signs Monitor
- For 24/7 or multi-lead monitoring: Consider Holter or a larger clinical device
- For best overnight oxygen monitor for home use: Look for devices with clear trend graphs and event markers
- For cheap and best BP monitor: Prioritize accuracy, memory, and ease of reading trends
How to Maintain Accurate and Reliable Trends
- Use your device at the same times each day—morning and evening are typical for BP and SpO2.
- Follow cleaning and maintenance instructions (see manufacturer’s guide or our device cleaning resources).
- Transfer and back up your data regularly. Use secure apps or encrypted storage if sharing with your provider.
- Update device software when prompted to ensure accuracy and data security.
Summary: Take Control with Informed Trend Interpretation
Reading your home patient monitor trends isn’t just about numbers—it’s about noticing patterns and changes you can act on. By understanding your reports, maintaining your devices, and asking informed follow-up questions, you turn raw data into meaningful health insight. If you’re ever in doubt, or if your trend graphs show new or concerning patterns, use your exported reports to start a conversation with your healthcare provider.
